
PV has seen rapid growth in recent years. With this growth, it is important to ensure that these PV systems are delivering the desired performance. A suitable performance monitoring system is used for logging energy output and weather parameters. With more PV plants turning online, data that is collected during PV plant operation is also increasing. The effective and accurate data analysis can help overall progress of PV ecosystem. The SCADA (Supervisory Control and Data Acquisition) data is being explored for predictive operation and maintenance (O&M). This involves detecting anomaly in data and origin of that anomaly and further, identification of signatures of different faults.
In this study, one-month SCADA data from multi-MW PV plant was collected, having one weather station for the measurement of weather parameters. In this data, anomalous PV generation data was observed where generated DC current was not following expected relation with irradiance, as shown in figure. Ideally, it is expected that generated DC current should follow the observed irradiance. But, it can be seen from figure that these points go out of sync randomly.
The question is whether this should generate an alert for Operation & Maintenance team suggesting some possible issue to check out.
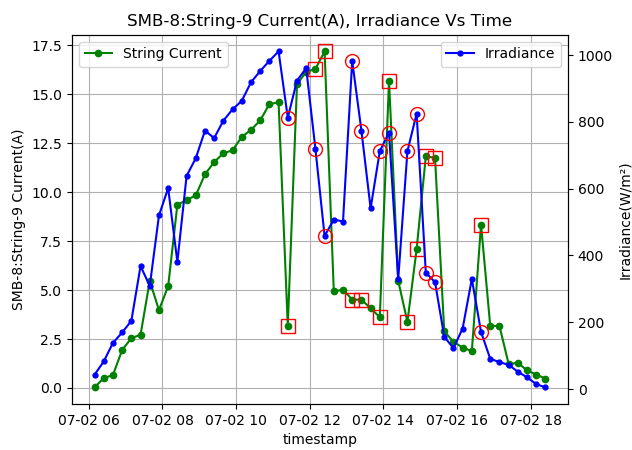
Soiling, encapsulant browning or partial shading due to some nearby objects can cause lower than expected current, but there was no consistency in lower currents. Also, it was known from site inspection that the modules did not suffer from partial shading. Also, one would expect smooth increment and then decrement in observed irradiance, but it shows some random oscillations over typical behaviour. This suggests the possibility of cloud cover over irradiance sensor.
Further, standard deviation in SMB currents as well as string currents was calculated at each time instance. It was observed that the data points which follow expected relation have shown lower standard deviation than the points that do not follow expected relation. Through this process of elimination, this behaviour can be explained by cloud movement causing partial shading of various blocks of modules and irradiance sensor.
Such issues caused due to cloud cover over the plant can be minimized by installing more sensors spread over the plant, to capture actual variation in weather parameters. Alternatively, these anomalous data points can be filtered out from further data analysis by investigating time-series of current and irradiance.
To know more about this topic, please refer to the following paper:
People involved in this work –


dkabra@iitb.ac.in
vasi.juzer@gmail.com
anilkg@ee.iitb.ac.in
naren@ee.iitb.ac.in